Scroll narrative from the closed blood draw through the sample to the digital twin on your devices. With reduced motion or without WebGL, eight quiet chapter images with the same text are shown.
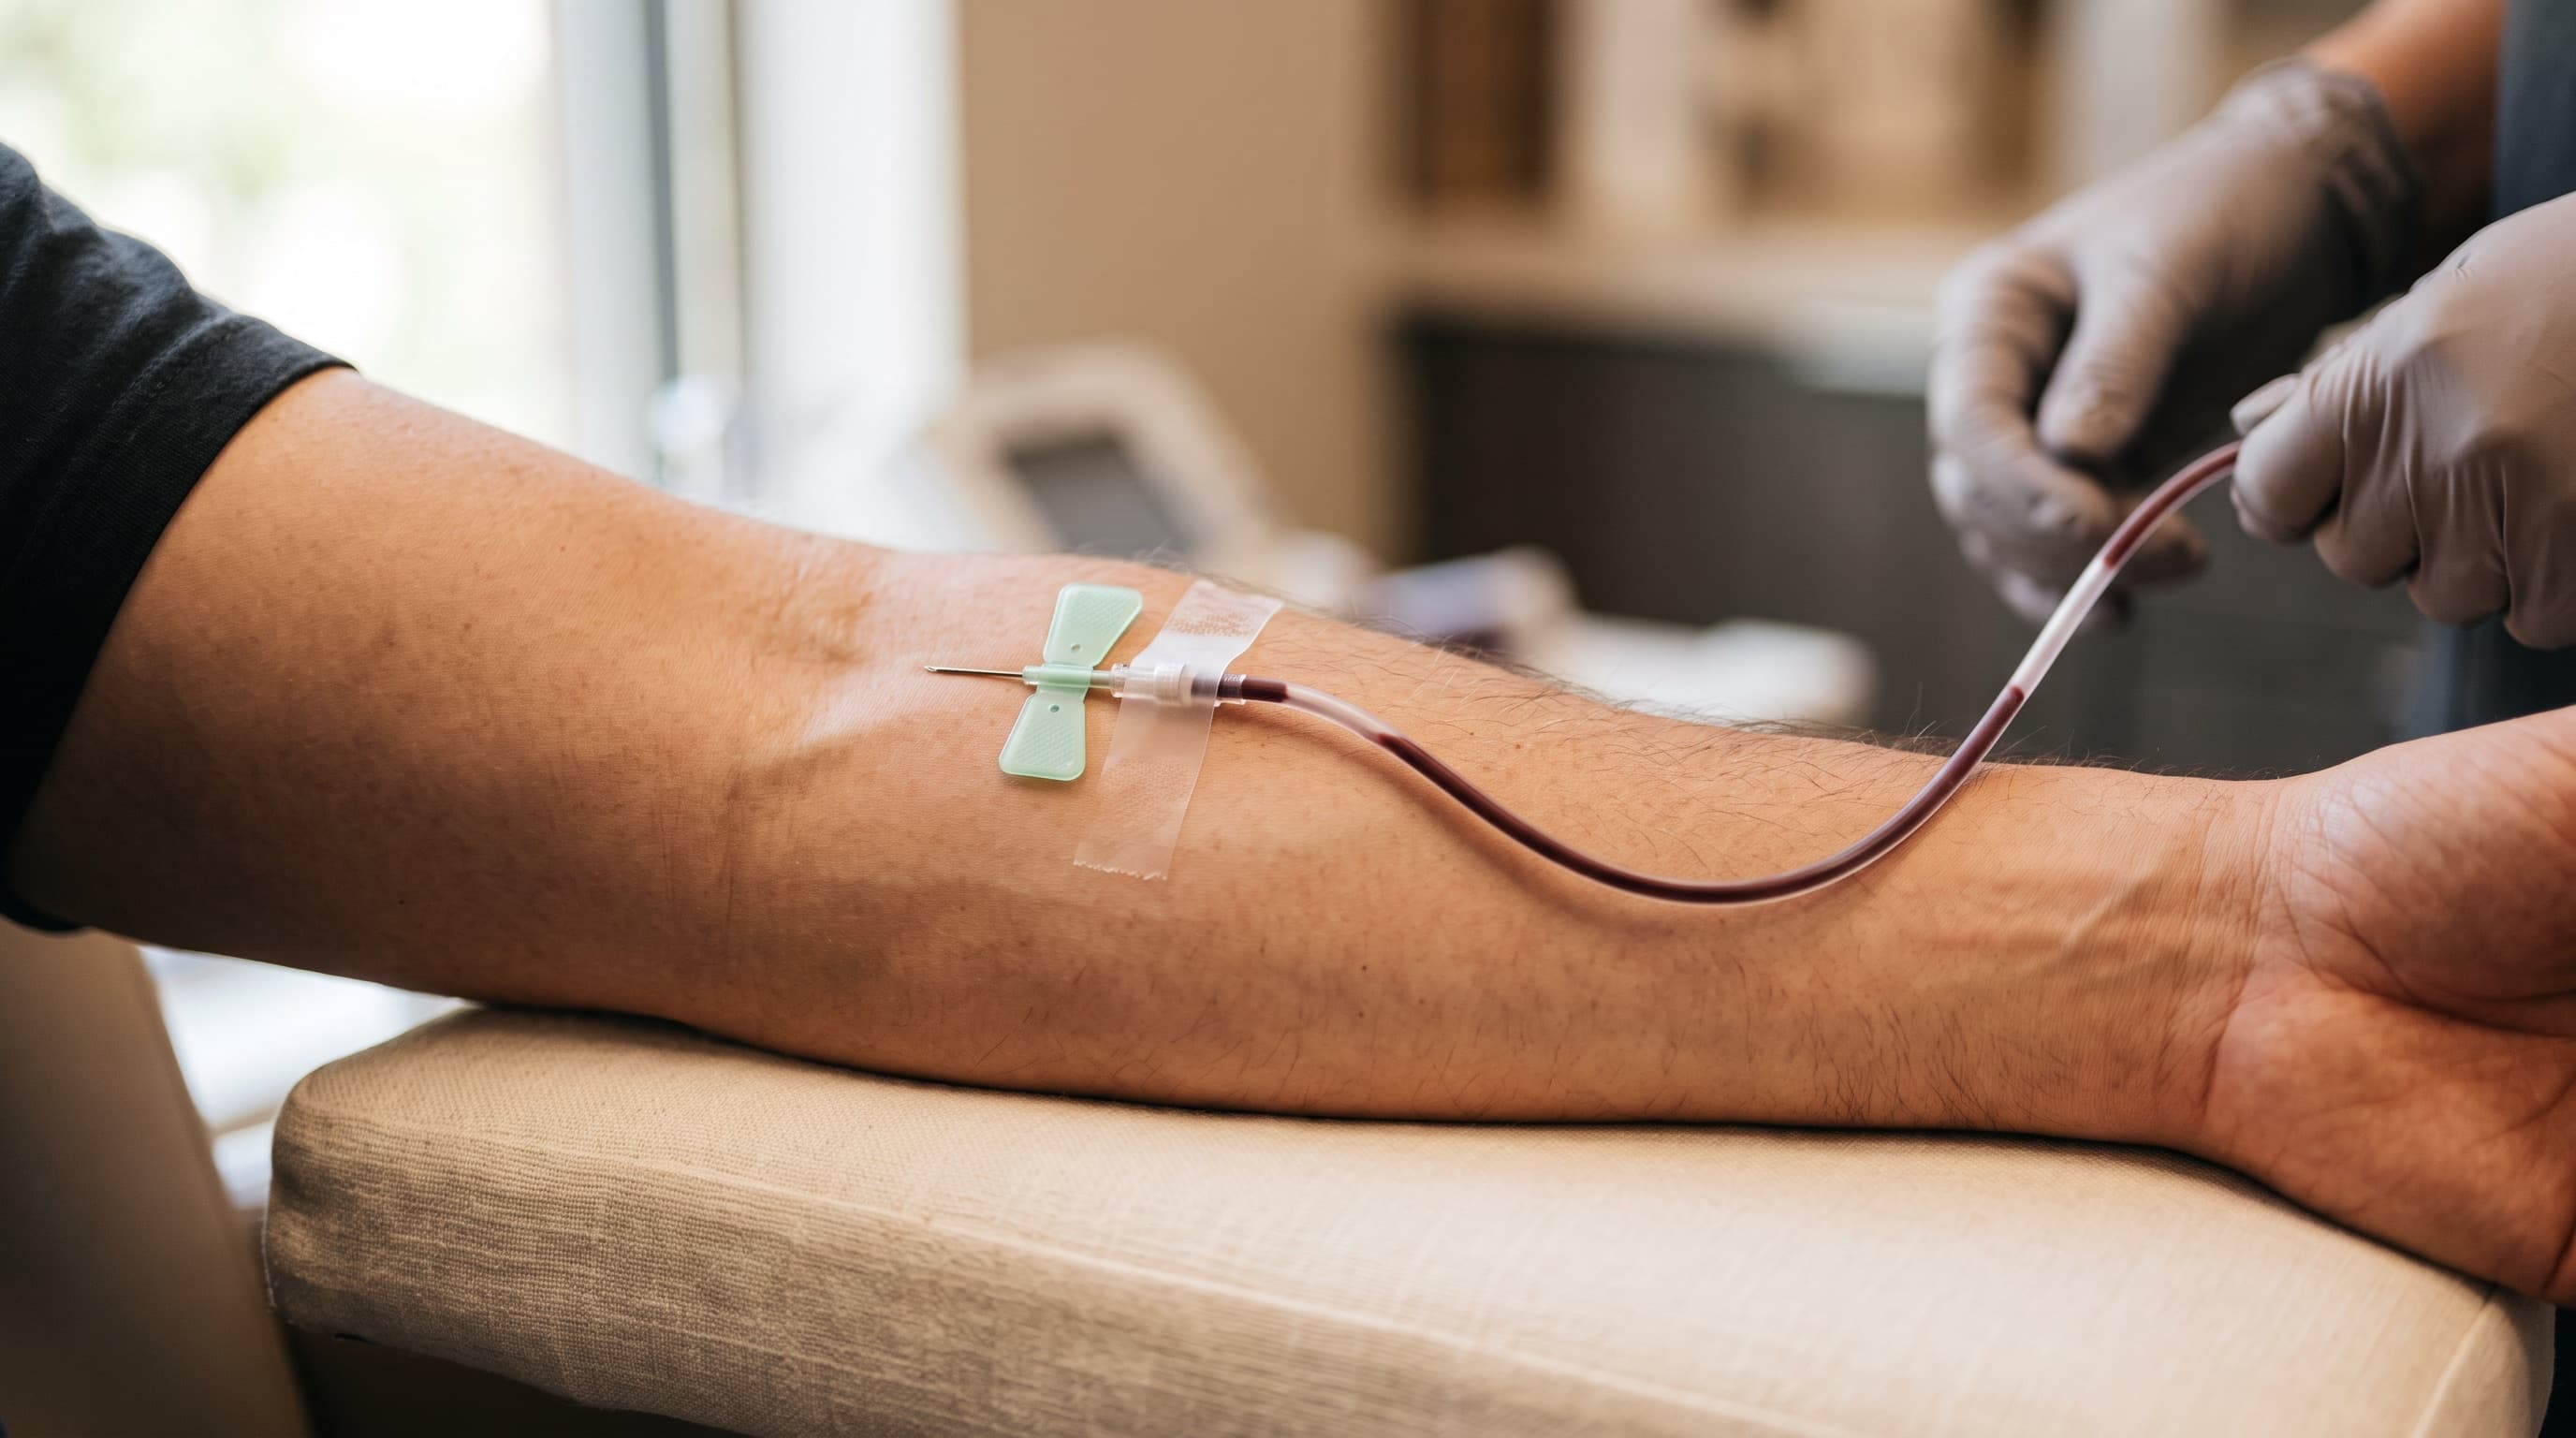
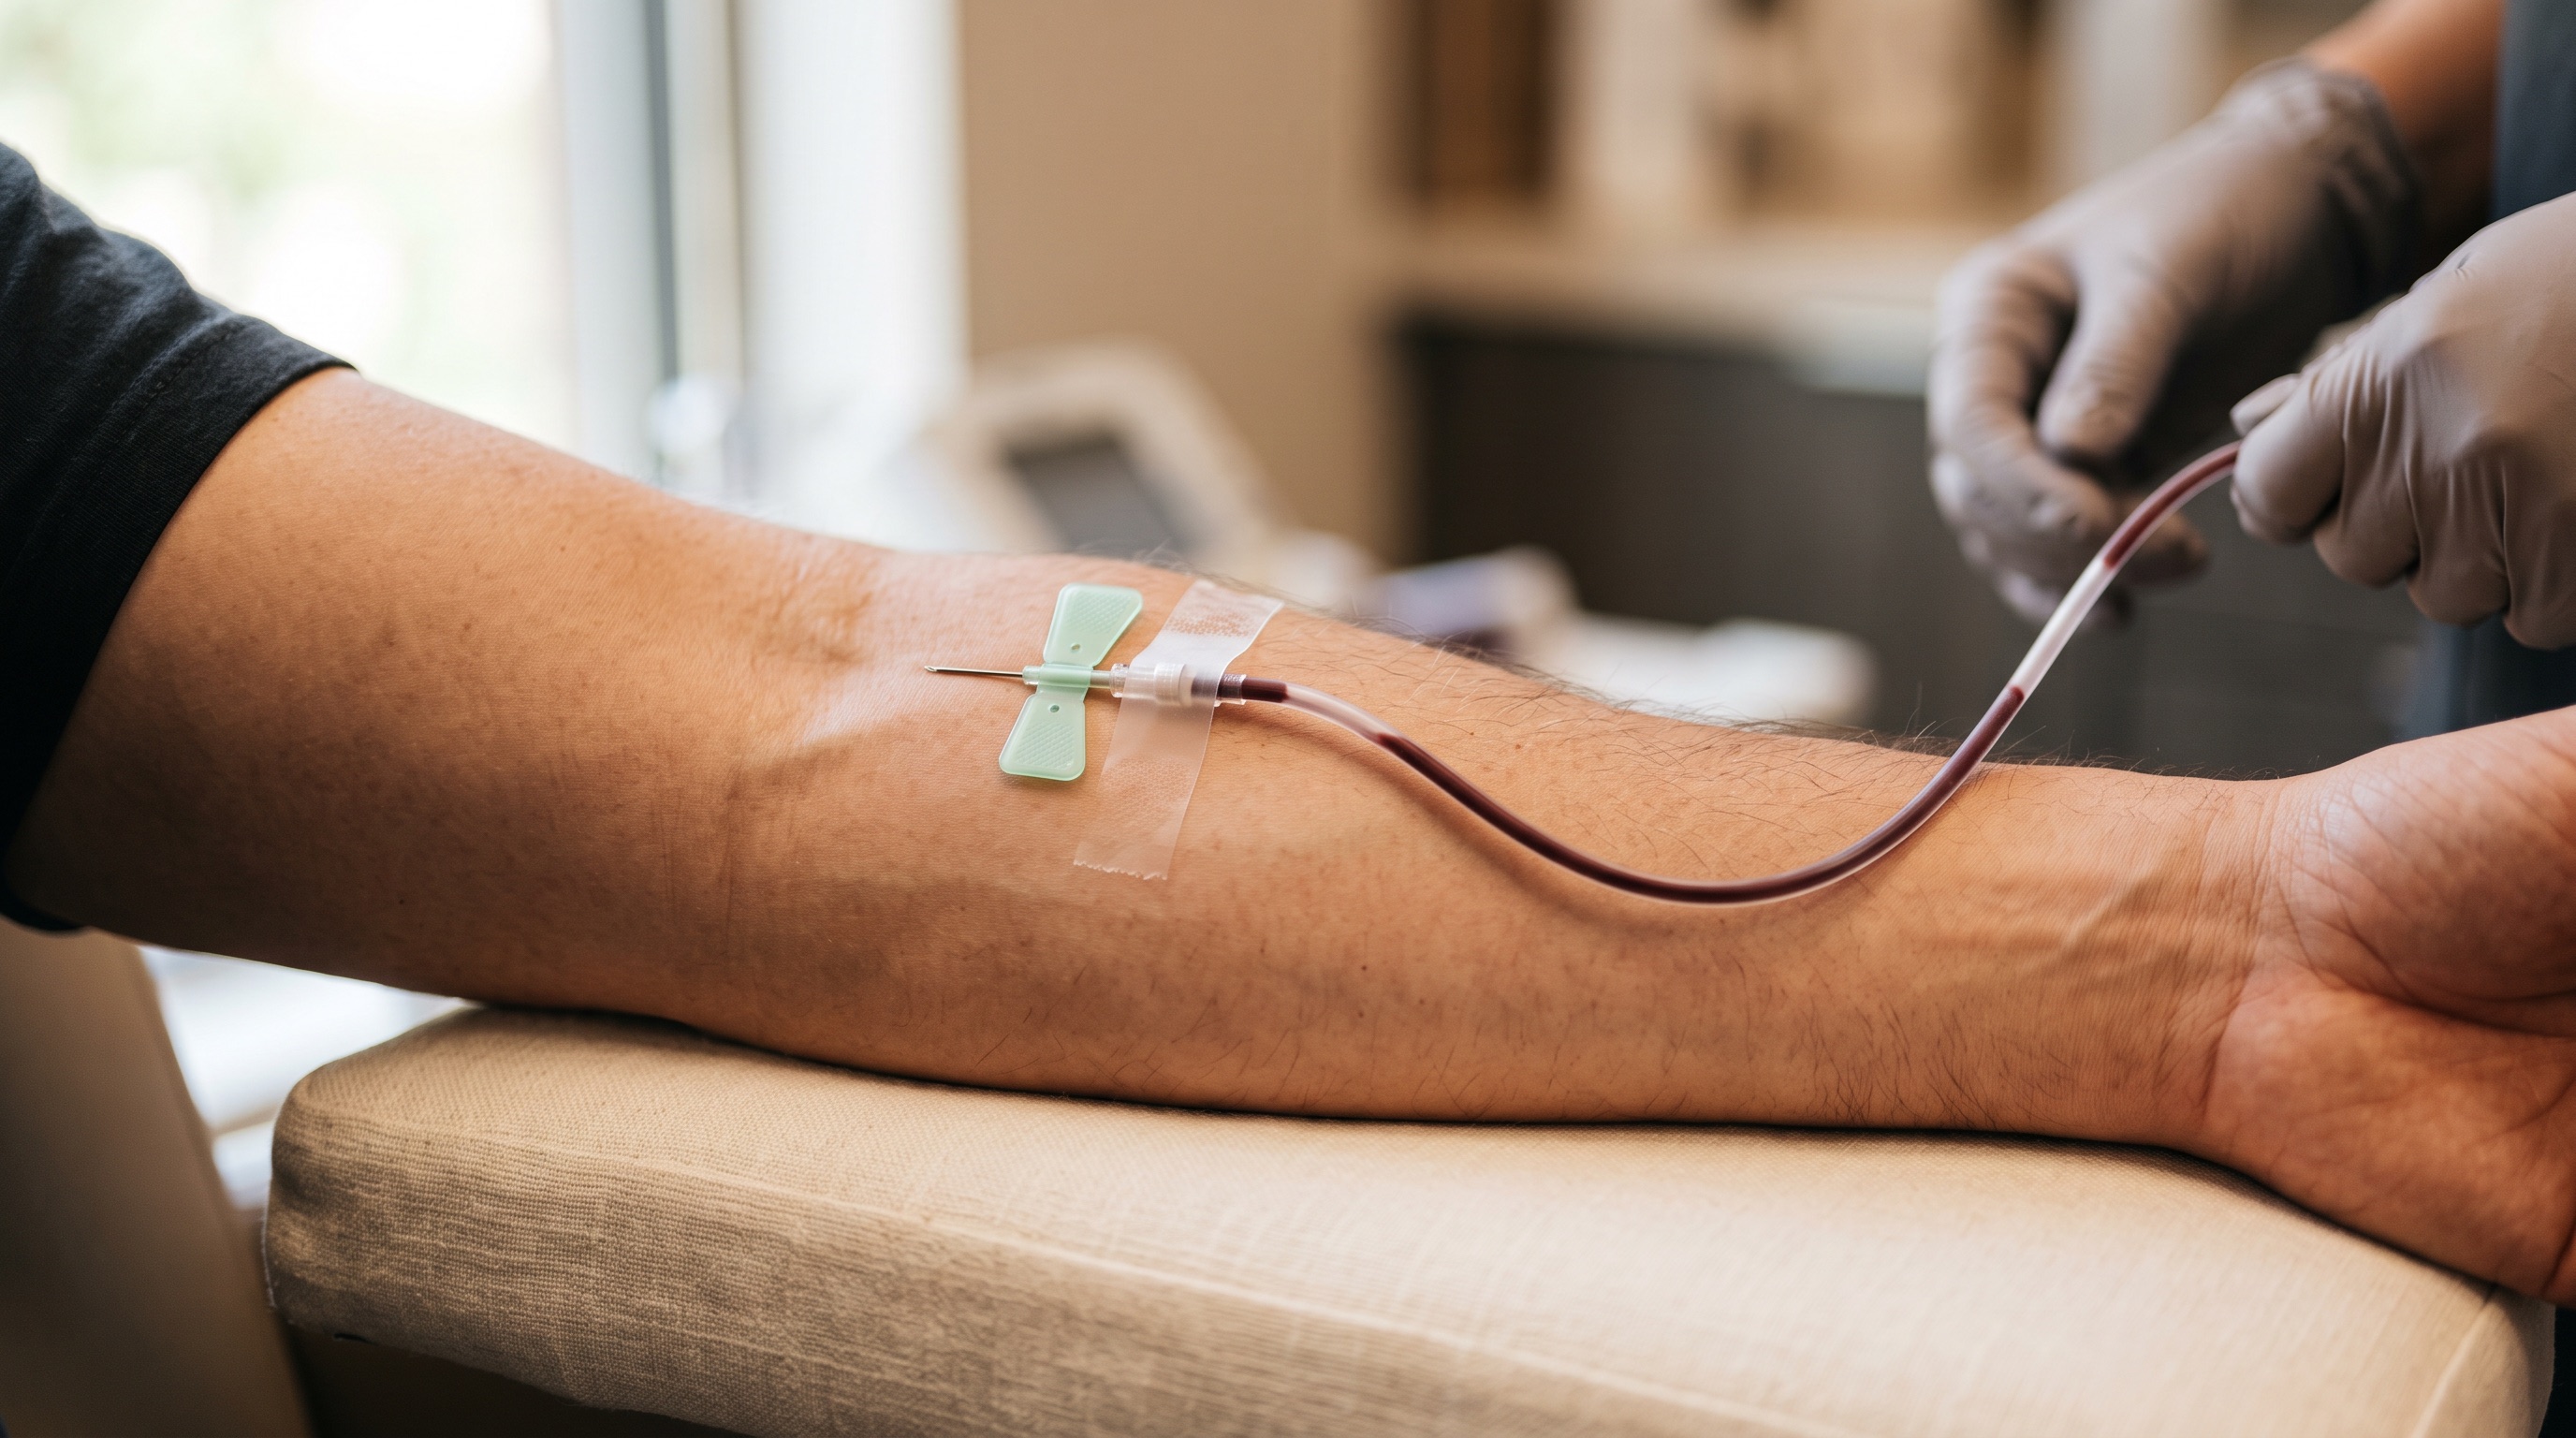
Blood test or body check at the outset: your results flow straight into your Digital Health Twin. Where every value comes from stays traceable.

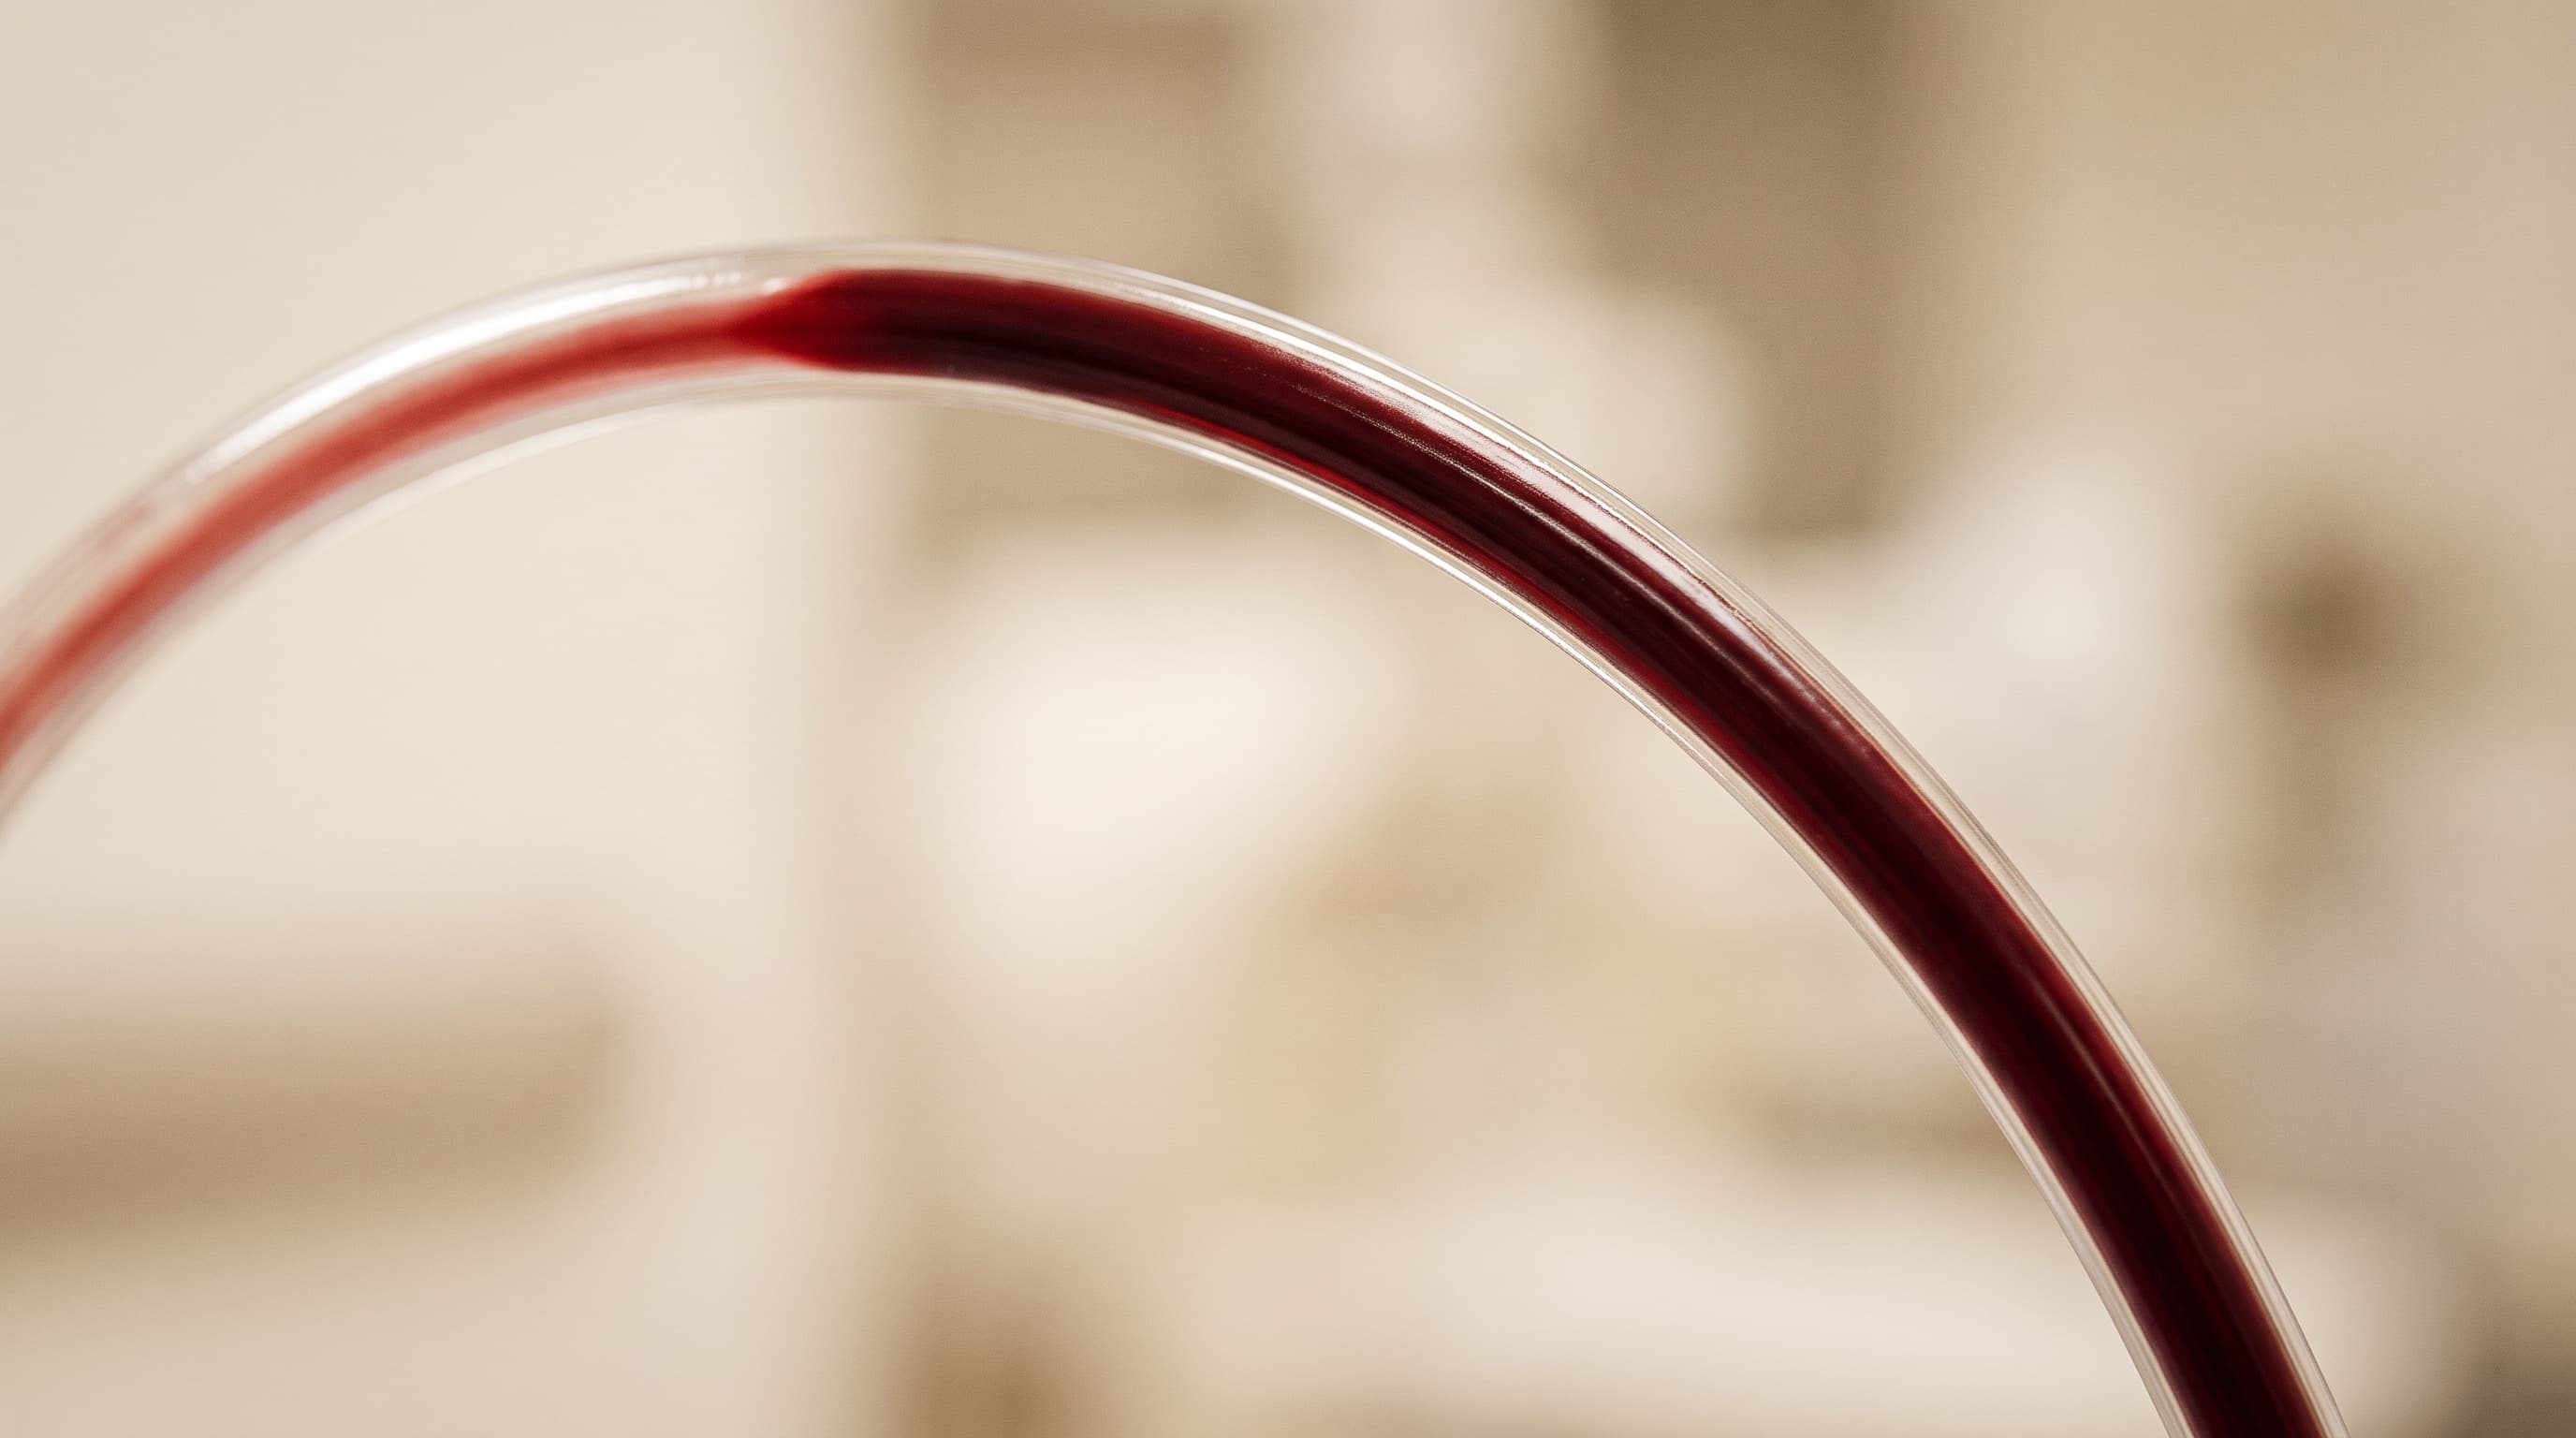
What moves through the tube carries hundreds of analysable parameters. Precision starts here — with a reliable sample under controlled conditions.
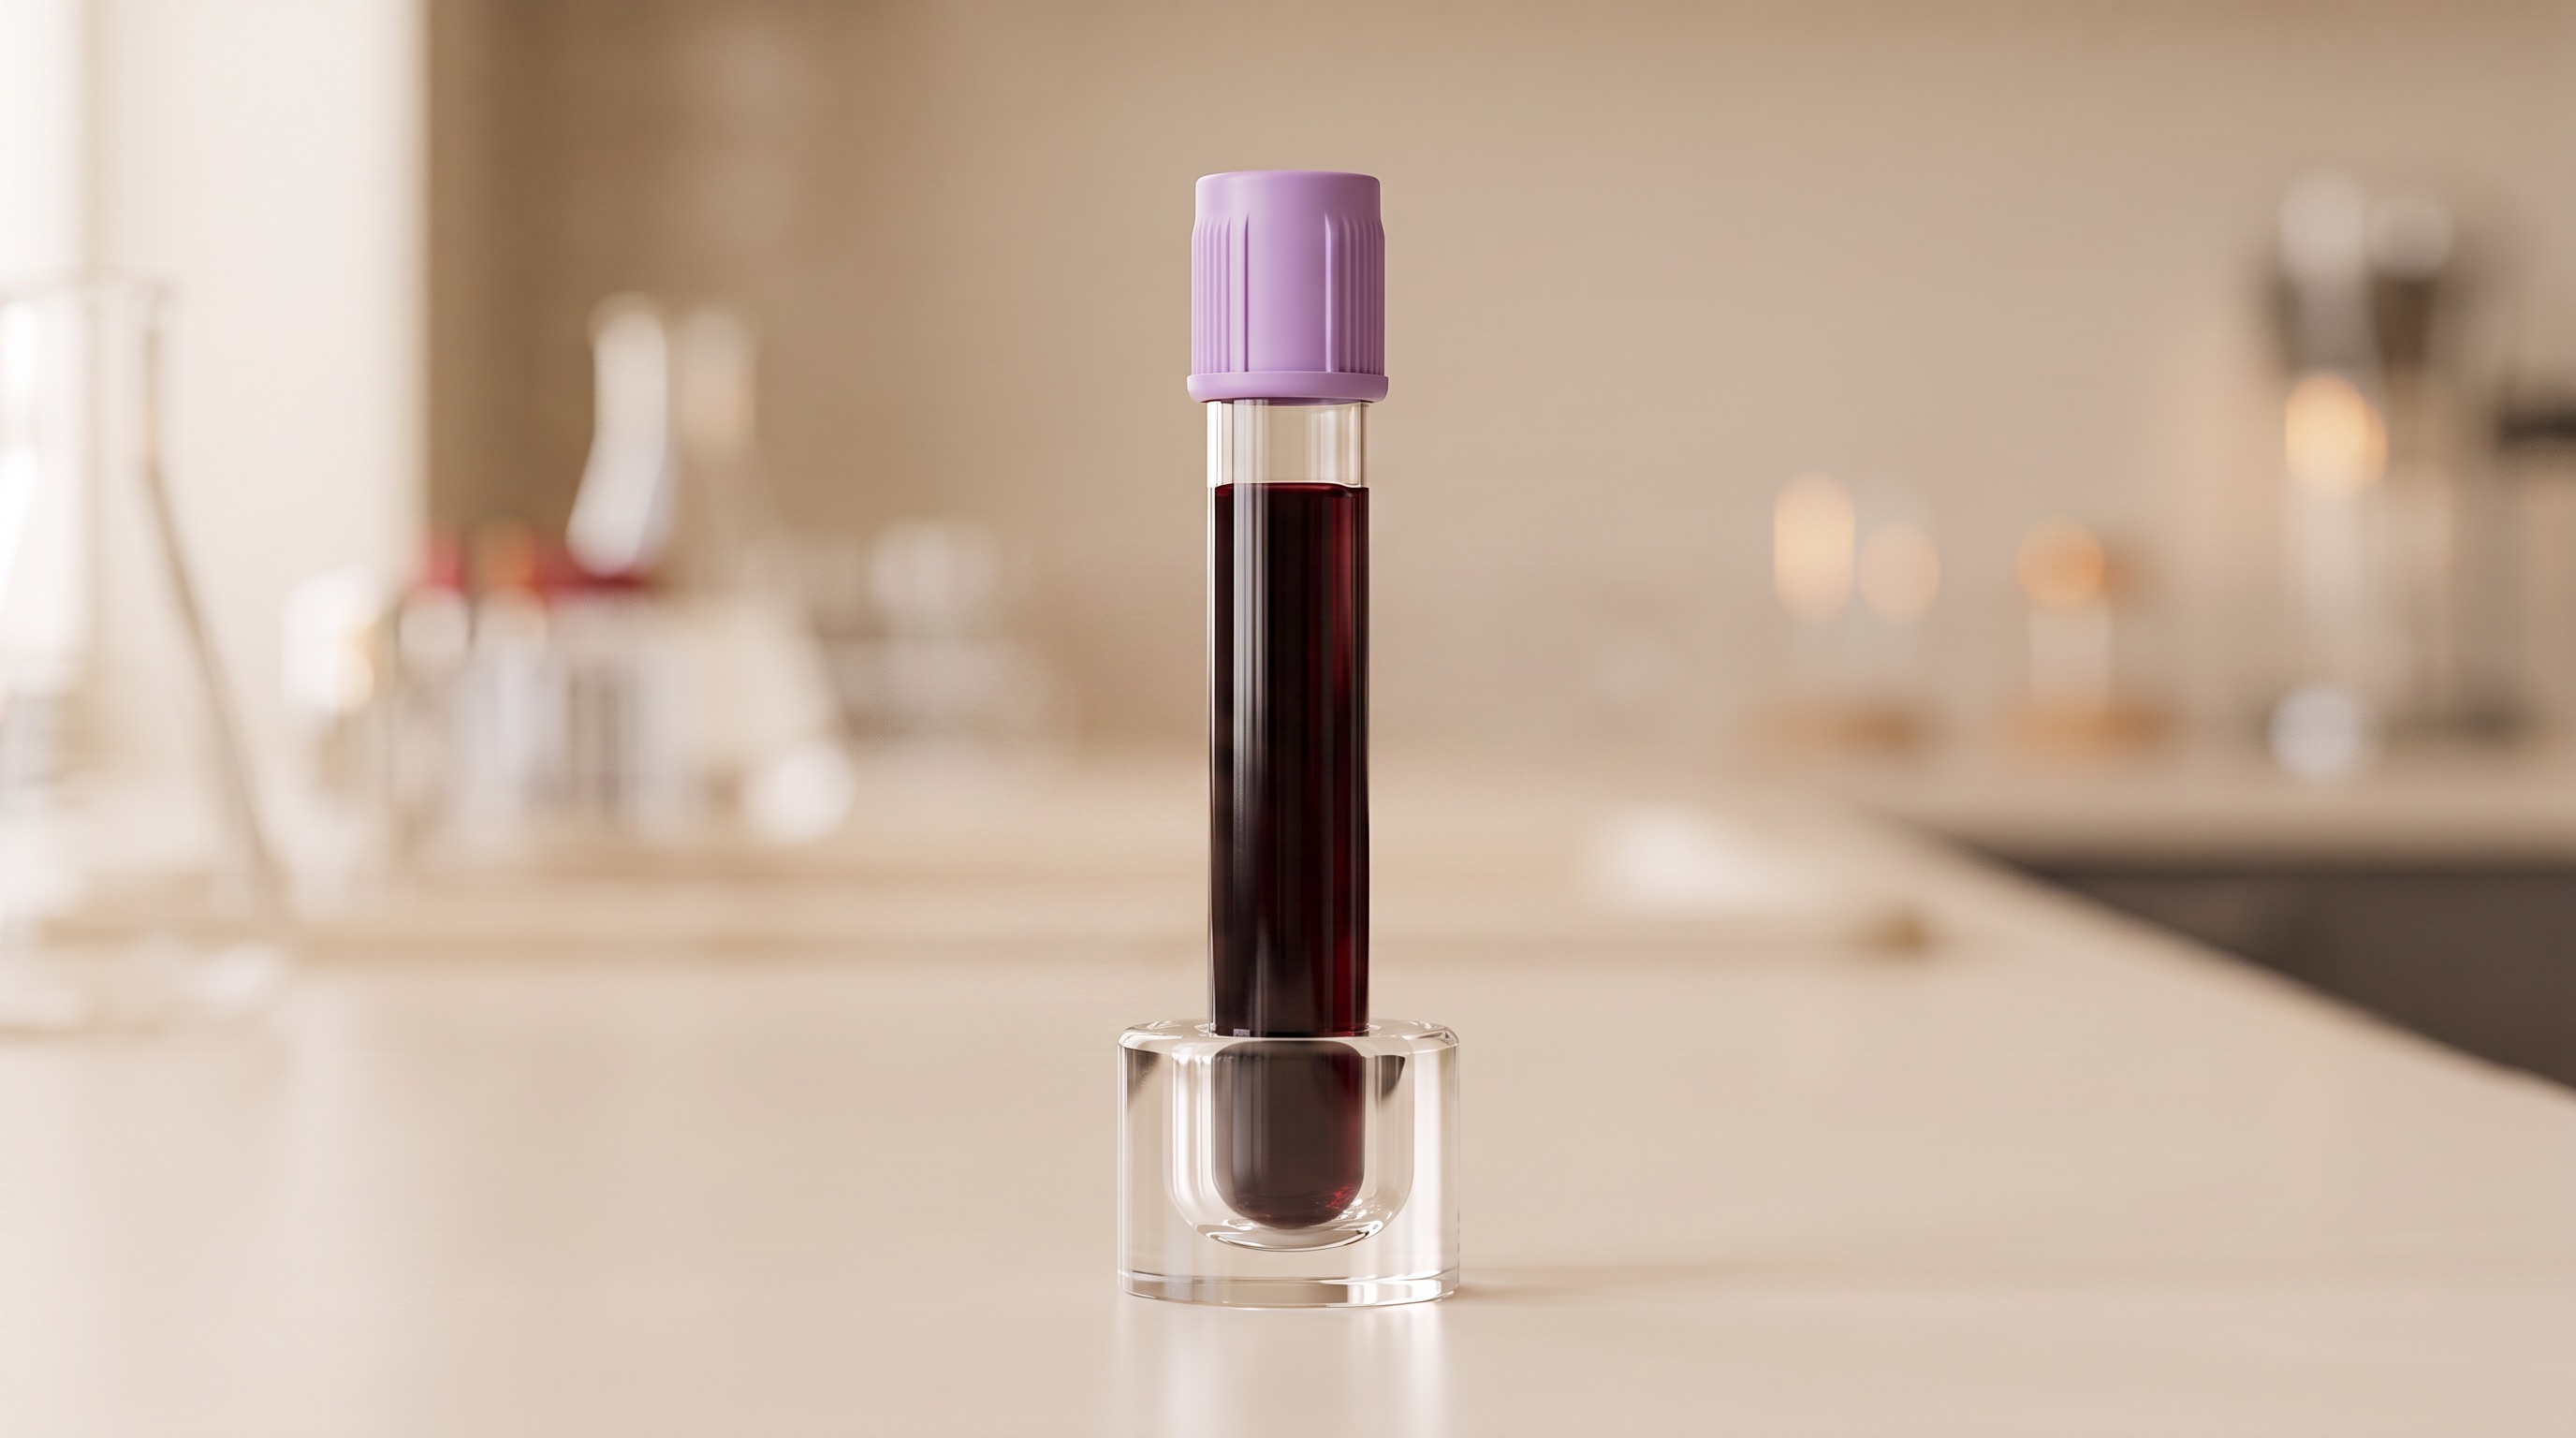
From HbA1c through the lipid profile to inflammatory markers: every lab value is captured, clinically classified and read in your whole profile.
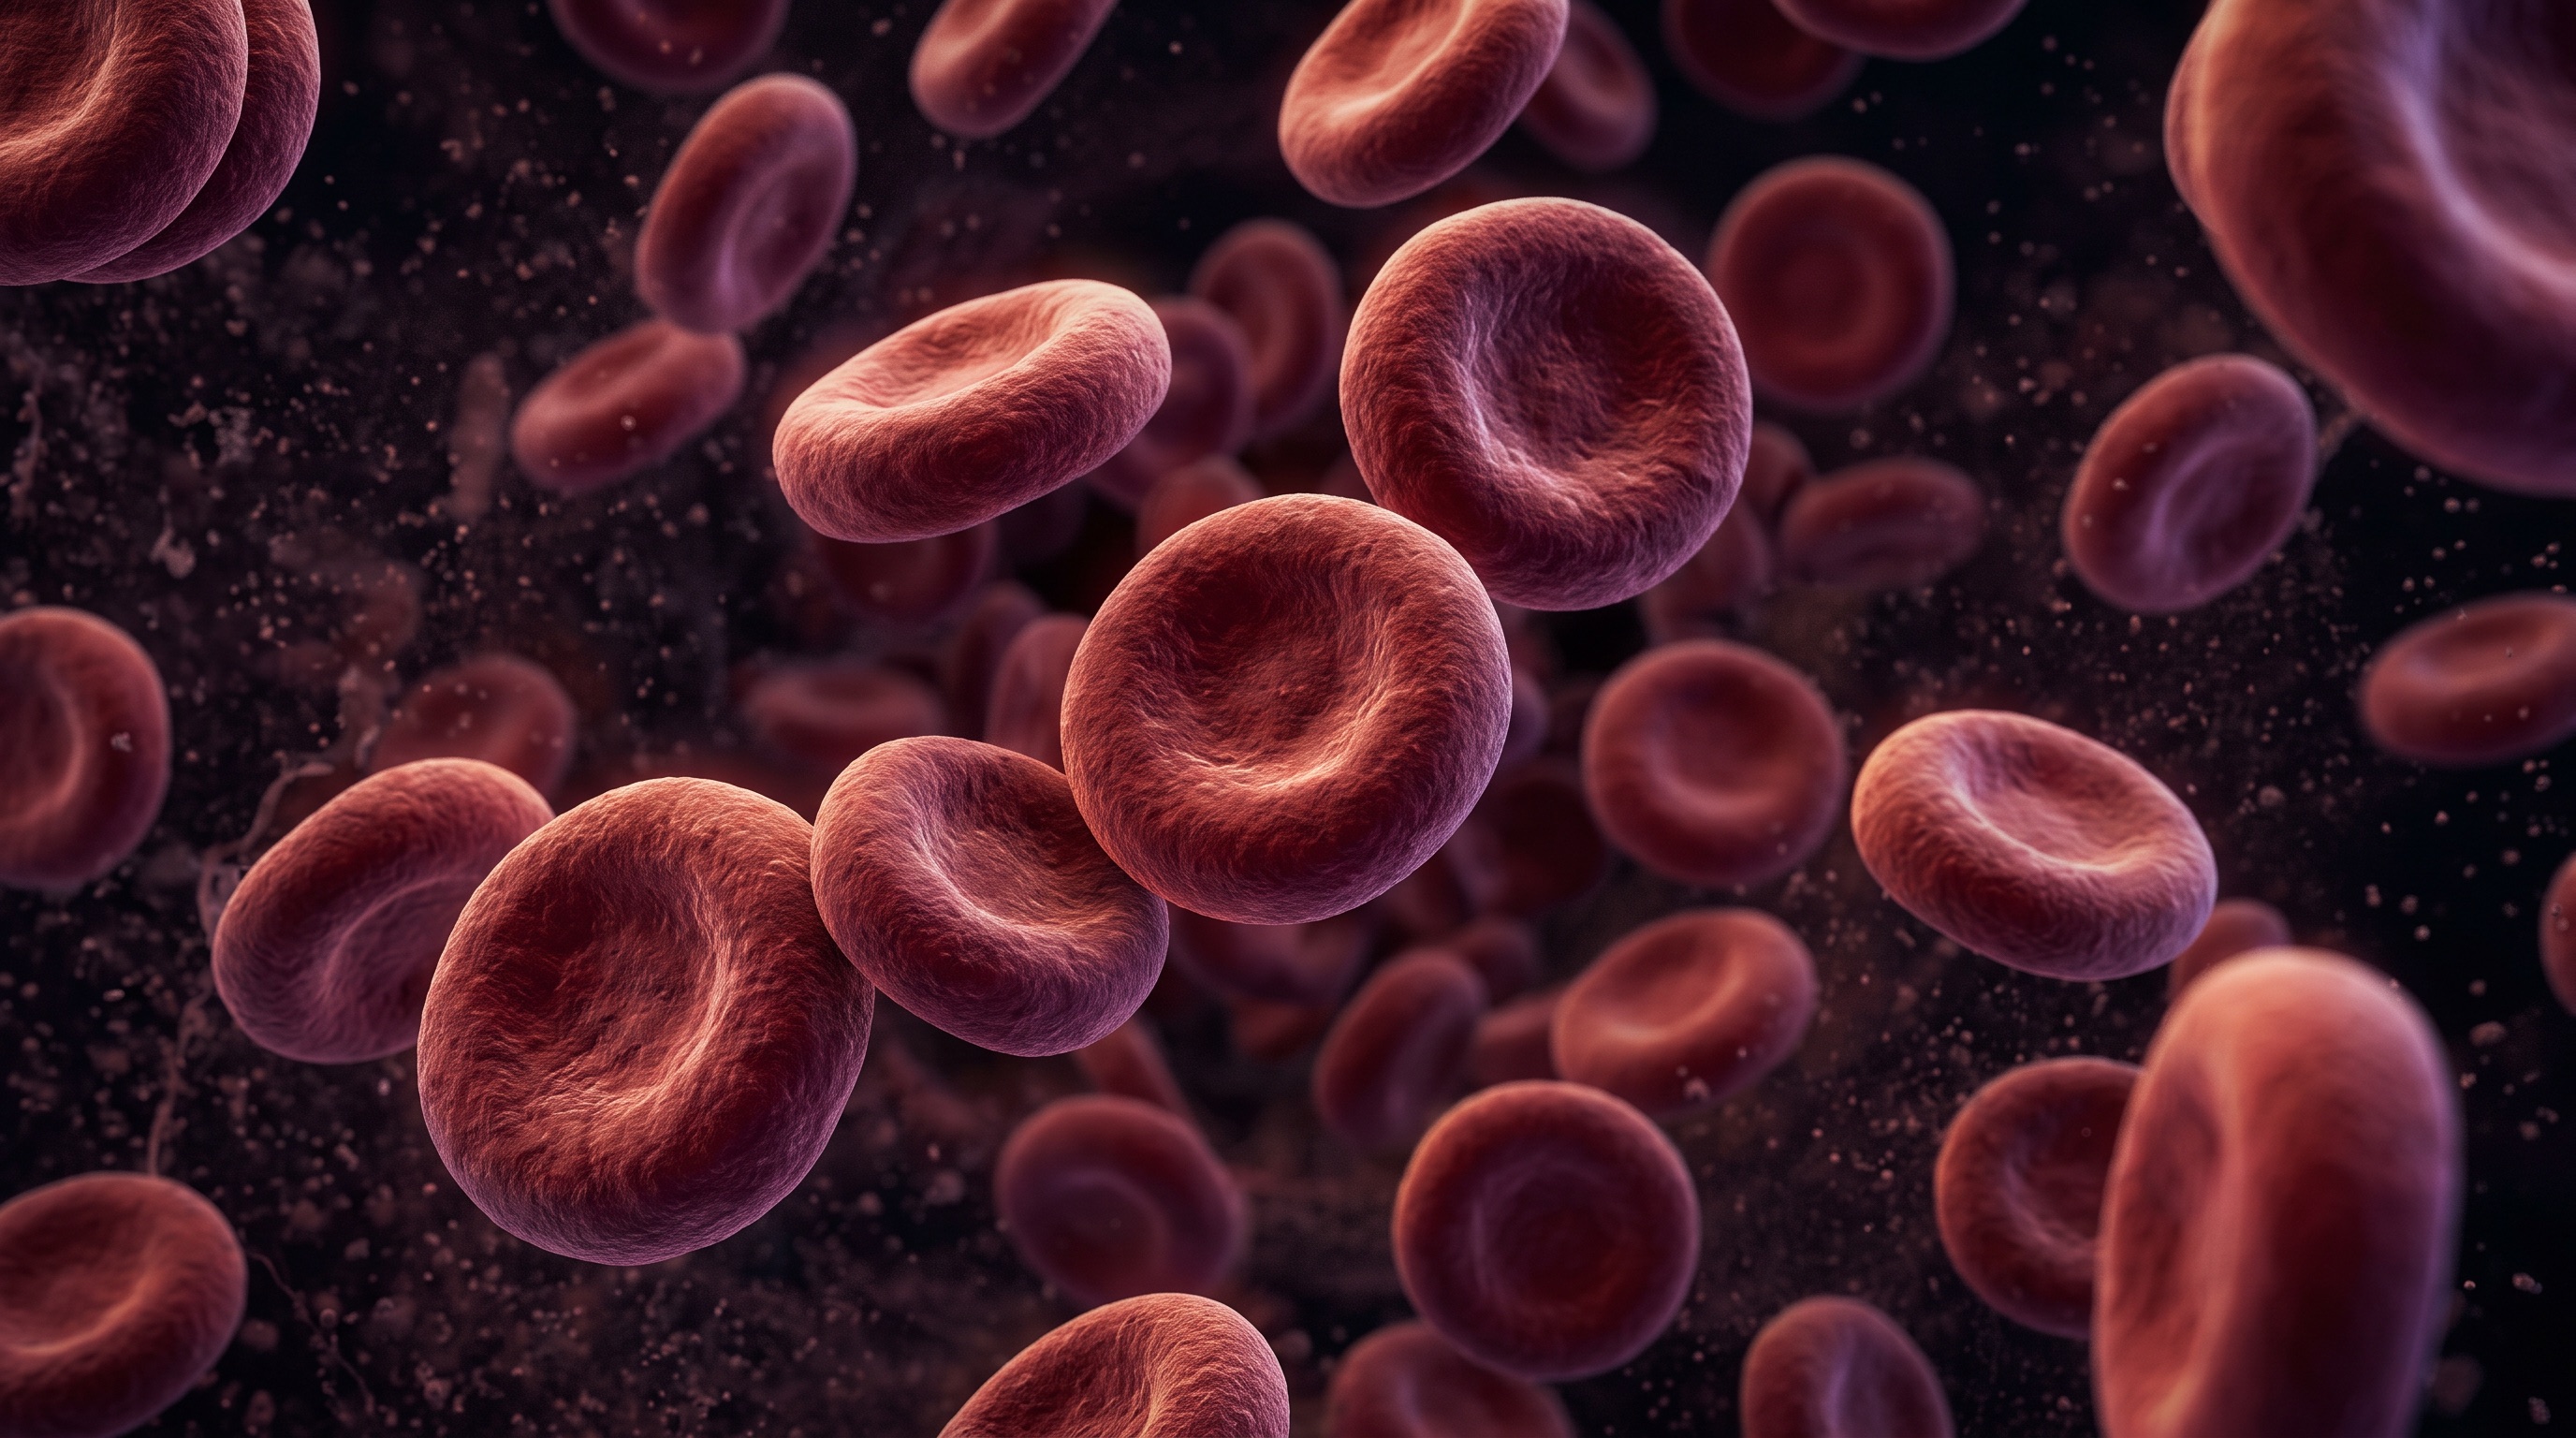
Your creatinine alone says little — with GFR and blood pressure a picture emerges. The view moves from the single value to organ system function.
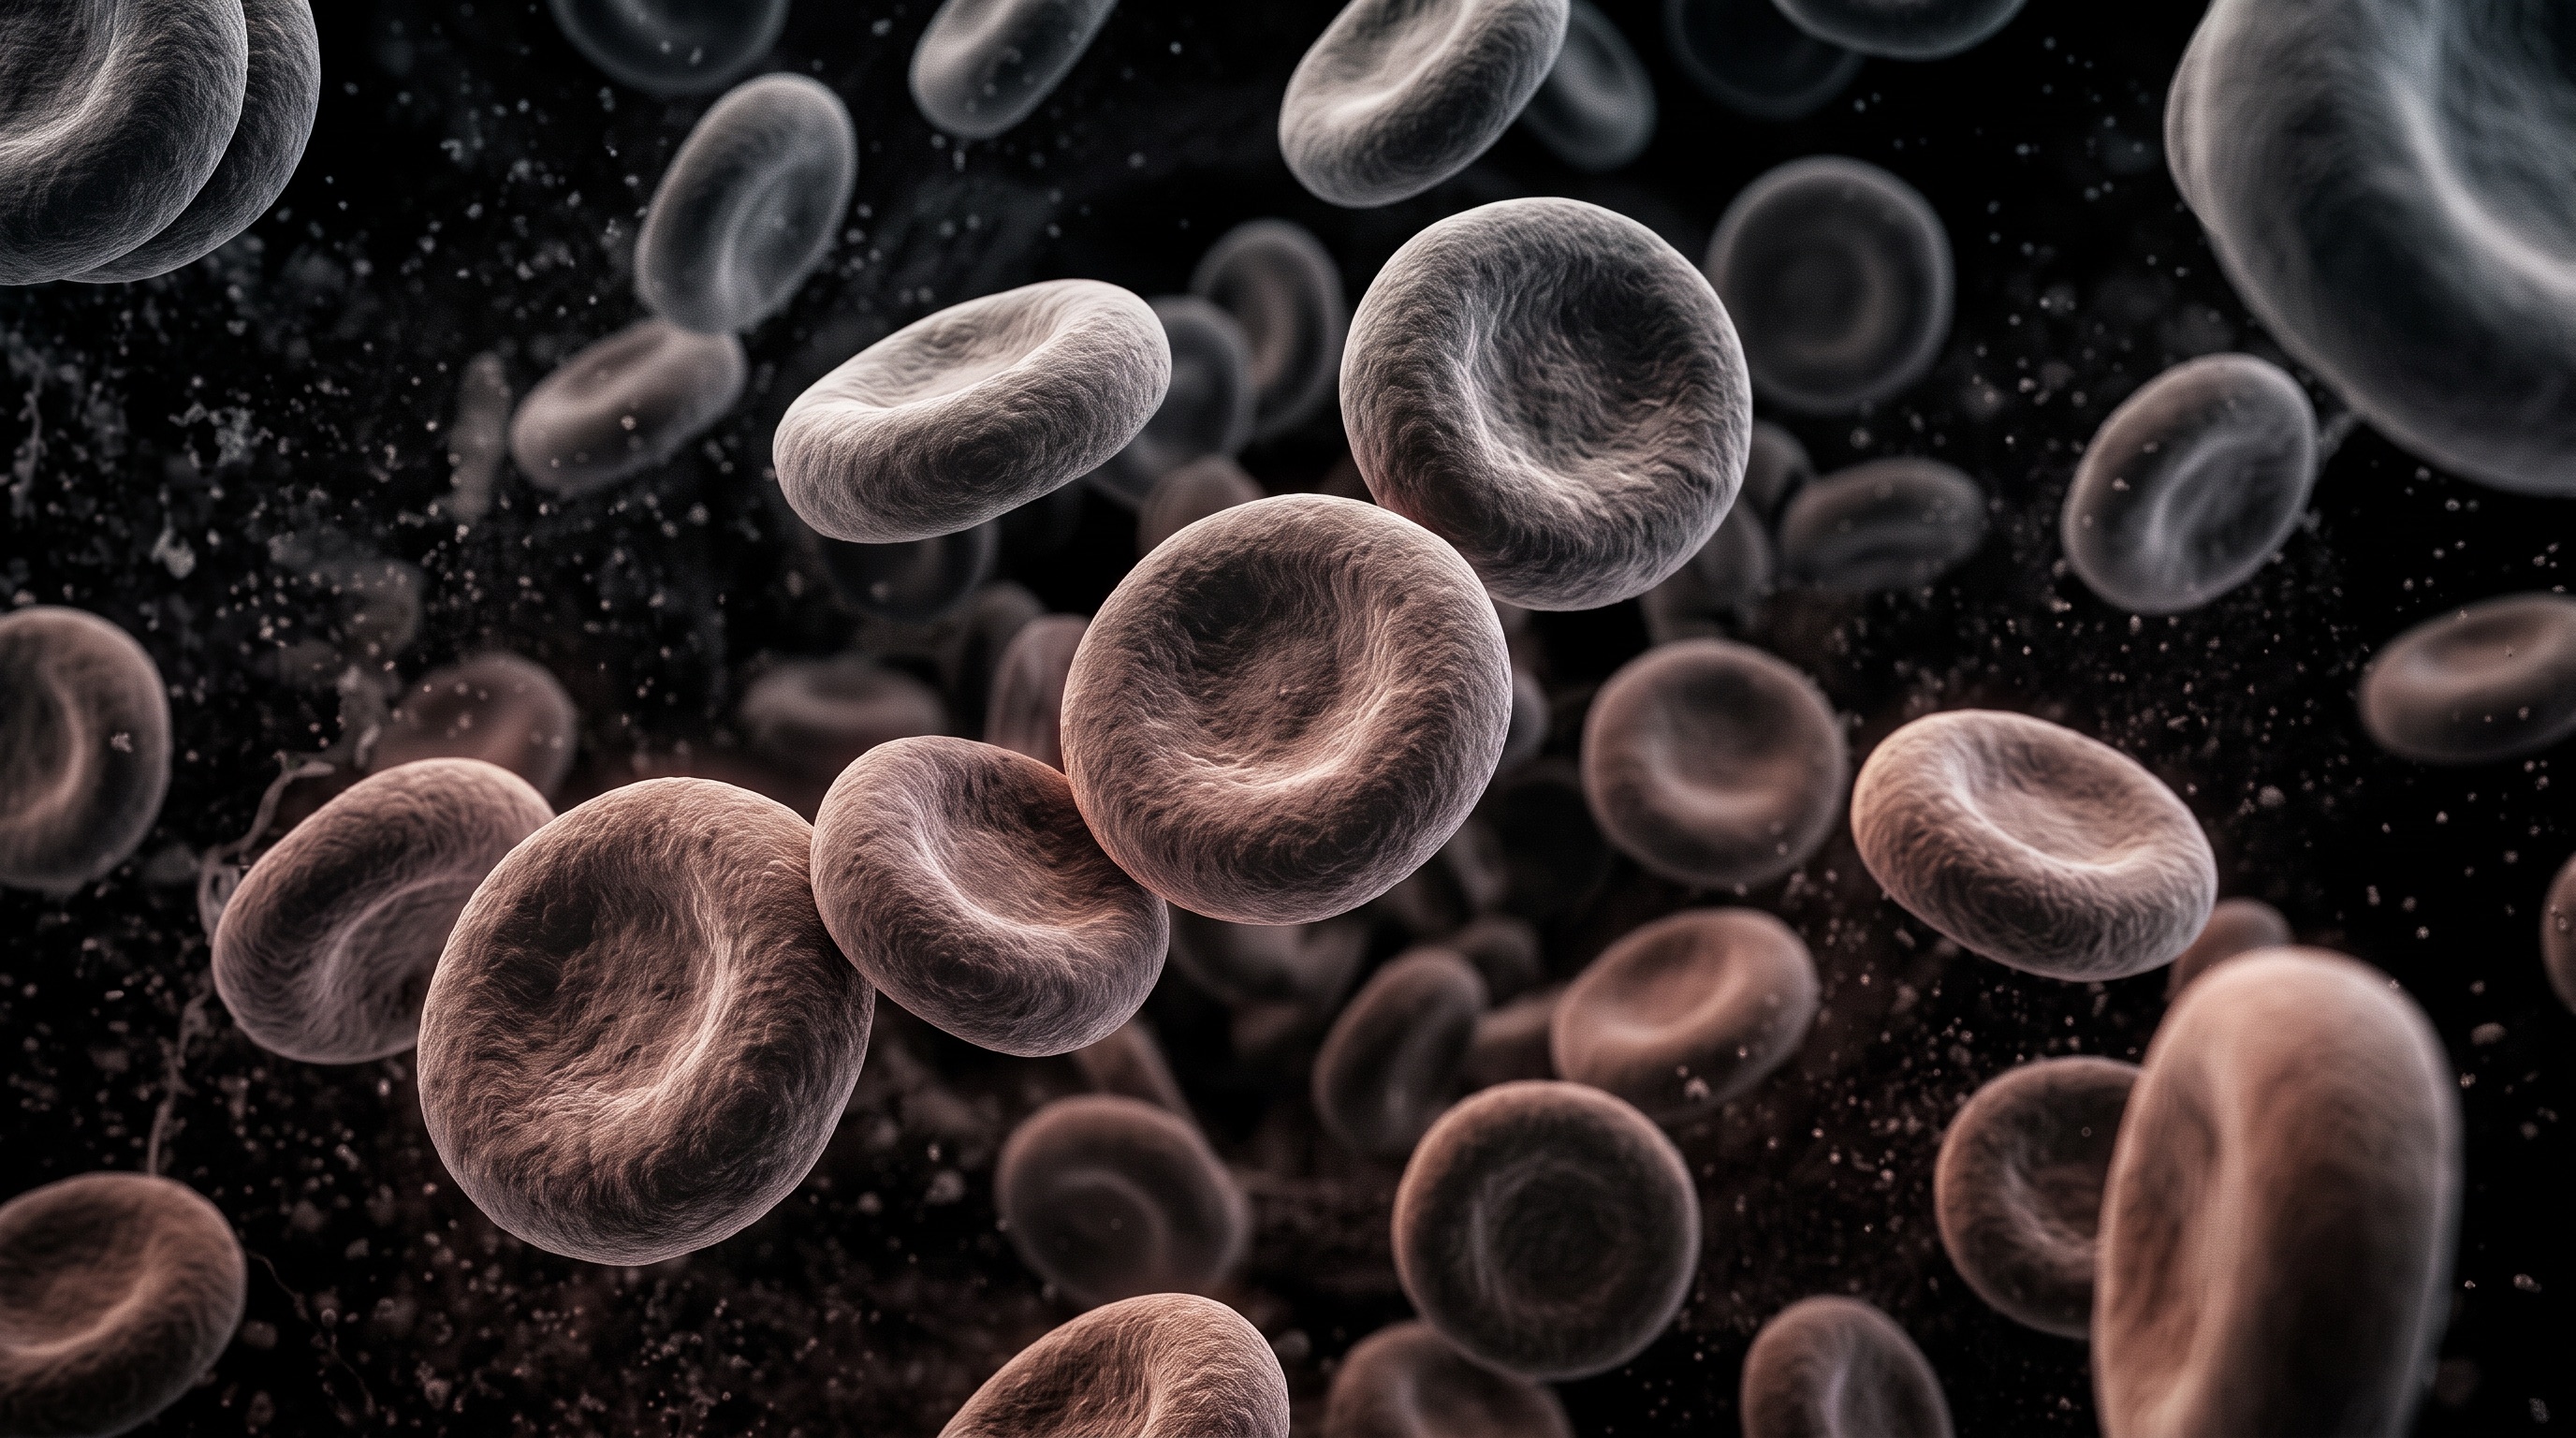
Liver, kidney, thyroid, heart: your twin maps the function of your organ systems — backed by lab parameters such as AST, ALT, creatinine and TSH.
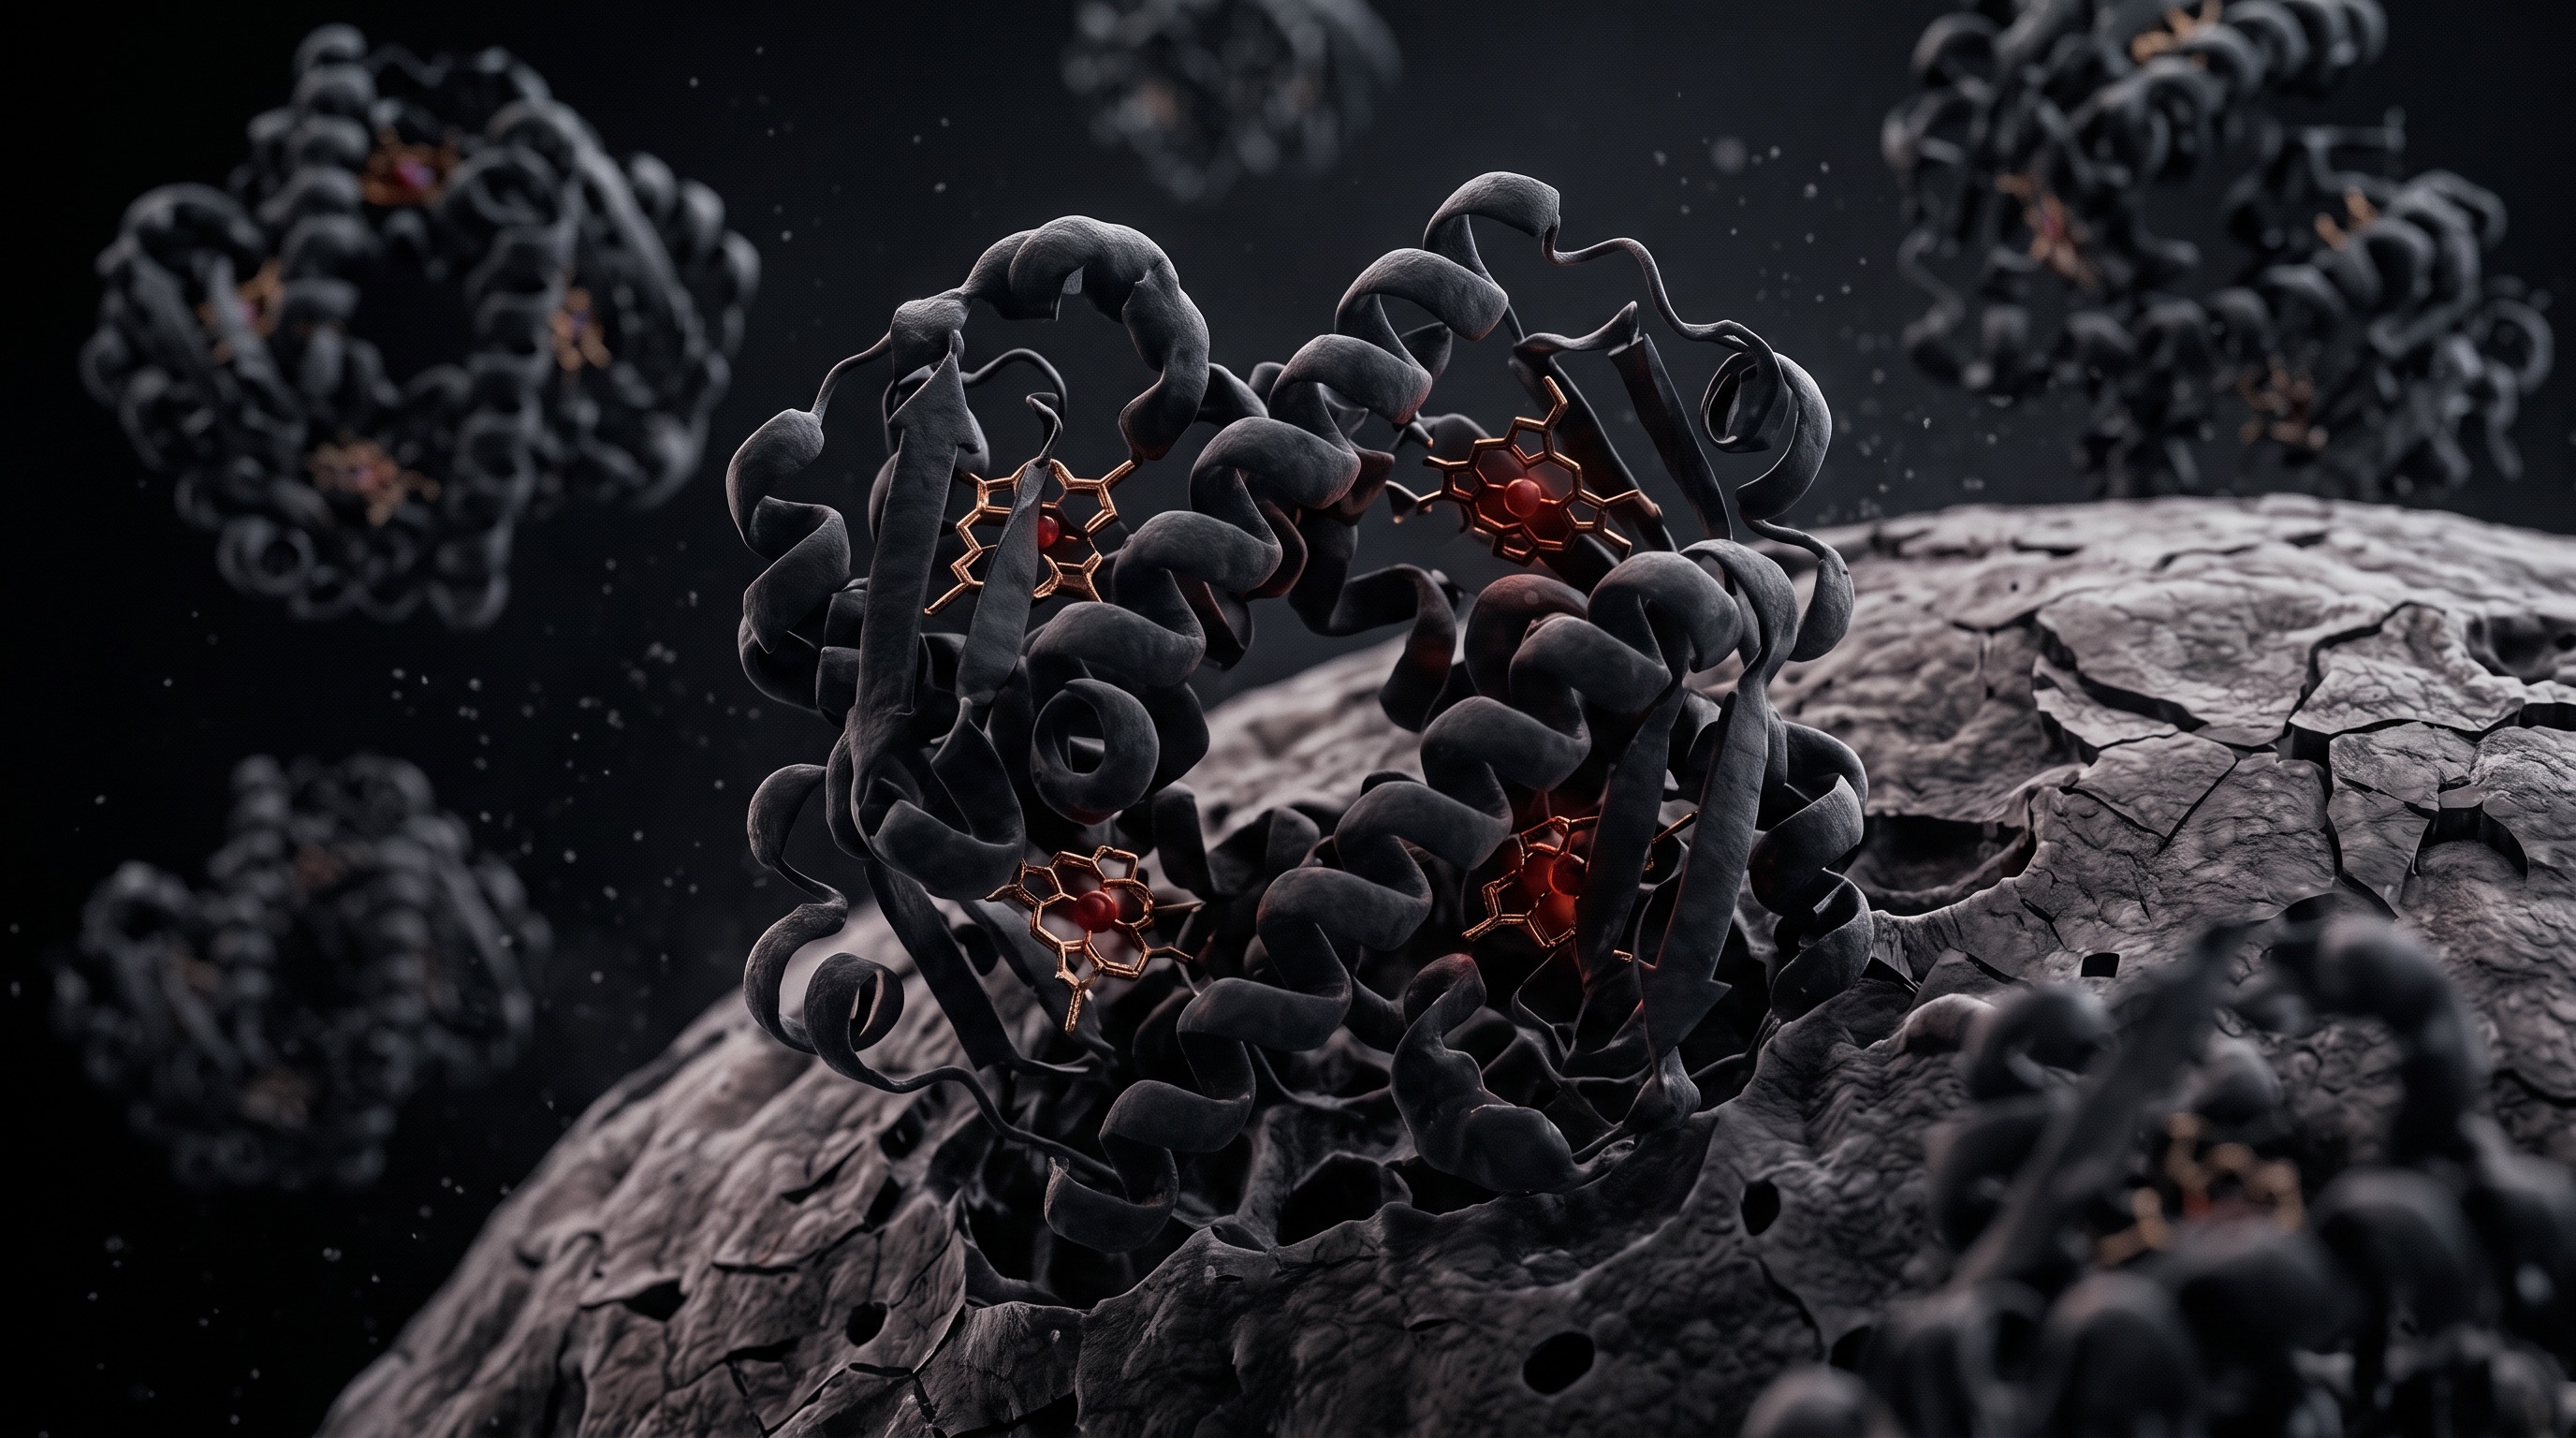
Haemoglobin and haem groups stand for molecular relationships that can be measured. Here it is decided what a value means biologically.

351 lab values, 193 conditions, 29 organs — more than 1,500 medical relationships become one model showing how your body is connected.

A 3D avatar shows organs, vital signs and trends over time, synced with your wearable. All data is processed in Germany.
Visualized representation
Think health ahead.
Deep diagnostics, clinically reviewed interpretation and a personal plan that evolves with you.
Illustrative display, no real data
A sample becomes measurable signal.
What moves through the tube carries hundreds of analysable parameters. Precision starts here — with a reliable sample under controlled conditions.
Over 80 biomarkers from one tube.
From HbA1c through the lipid profile to inflammatory markers: every lab value is captured, clinically classified and read in your whole profile.
Medicine is no puzzle of single values.
Your creatinine alone says little — with GFR and blood pressure a picture emerges. The view moves from the single value to organ system function.
Organ systems, not just numbers.
Liver, kidney, thyroid, heart: your twin maps the function of your organ systems — backed by lab parameters such as AST, ALT, creatinine and TSH.
Structure becomes building blocks.
Haemoglobin and haem groups stand for molecular relationships that can be measured. Here it is decided what a value means biologically.
The Visual Graph connects it all.
351 lab values, 193 conditions, 29 organs — more than 1,500 medical relationships become one model showing how your body is connected.
Your twin. On your devices.
A 3D avatar shows organs, vital signs and trends over time, synced with your wearable. All data is processed in Germany.